

Southwest monsoon 2019 took everyone by surprise and proved it is the master
The southwest monsoon 2019 would be remembered for the twists and turns and the numerous rainfall records it broke, despite a late onset and 33 per cent deficient rainfall until June end


“Dramatic, furious, capricious, overwhelming” – some of the adjectives well suited to define the 2019 southwest monsoon. In the decades to come, 2019 would be remembered for its marked performance that surpassed the expectations and predictions of weather forecasting agencies worldwide. That is the kind of impression 2019 monsoon season has left in the weather world.
Quick flashback on the season’s forecast
As early as February 2019, the predictions for 2019 southwest monsoon started flowing in. The lone private weather agency of India – Skymet Weather – indicated there was a 50 per cent chance of a normal monsoon season, only to be countered by a media article, which highlighted a 50 per cent chance did not mean anything and it was too early to count the chickens before they hatch. Therefore, the initial forecast, in a simple term, was preposterous.
This forced the Skymet to provide a revised forecast in April 2019, projecting a “below normal” monsoon season this year, basing it purely on the development of the El Niño-Southern Oscillation (ENSO). It stuck by this forecast as late as August 2019, when it is prudent to do a mid-season correction.
The government body, India Meteorological Department (IMD), on the other hand, followed a more methodical approach, analyzing all its model outputs, before giving a “normal” forecast, which translates to rainfall being 96 per cent to 104 per cent of the long period average (LPA). In perspective, ‘below normal’ monsoon is 90-95 per cent of LPA.
Interestingly, the southwest monsoon season of 2019 ended at 110 per cent of LPA, bulldozing all the predictions and ending in the ‘excess’ category.
In this roller-coaster monsoon season, one should give due credit to the IMD for handing out a decent forecast and not getting biased by the ENSO development. This points to the fact that IMD’s forecasting model had probably accounted for the other ocean-atmosphere coupling, known as the Indian Ocean Dipole (IOD), although its effect was not fully realised in the model.
It was the tug of war between ENSO and IOD that led to an inaccurate forecast for this year’s southwest monsoon.
Global and local circulation patterns
The Indian summer monsoon, or the southwest monsoon, is governed by global and local circulation patterns, both of which are primarily driven by the ocean-atmosphere coupling. Among the global factors, El Niño-Southern Oscillation (ENSO) has a high impact on the Indian monsoon.
Simply put, ENSO is a coupled ocean-atmosphere signal in the Pacific Ocean, wherein the Central Pacific heats up to anomalous levels, thereby incurring less moisture to the Indian sub-continent. This results in below-normal monsoon (or even drought), since moisture is an essential ingredient for formation of rain-bearing monsoon clouds. It is well documented that El Niño is deleterious to the Indian monsoon, while La Niña its ally.
Akin to El Niño in the Pacific, there is a local factor known as the Indian Ocean Dipole (IOD), or Indian Niño, which to a large extent depends on the Indian Ocean dynamics.
During IOD years, warm (cold) pool of water is observed in the west (east) part of the Indian Ocean or vice versa. The IOD has two phases – positive and negative. In the positive phase of IOD, warm pool of water is seen in the Arabian Sea (close to the African coast), while the cold pool is seen near the Sumatra islands.
Monsoon 2019 sees strongest ever positive IOD
In scientific terms, the positive IOD (+IOD) is characterised by a Dipole mode index (DMI) that has to exceed a value of +0.40C. Research has shown that +IOD, in general, favours the southwest monsoon. If one looks at the DMI values from 1996 to 2019, it is discernible that 2019 was the strongest +IOD year ever recorded (see figure: Dipole mode index values 1999-2019). The last known strong +IOD years were in 1997 and 2006 when our southwest monsoon was ~100% of LPA during both the years. Strong +IOD events seem to follow a decadal cycle, meaning such events repeat roughly every 10 years.
Figure: Dipole mode index values 1999-2019 (Black circles mark the three strongest positive IOD years).
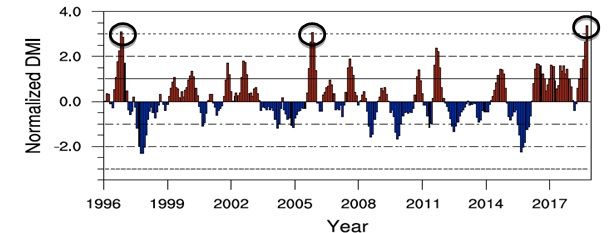
So far, the ‘claim to fame’ for IOD was associated with the year 1997, when monsoon was normal, as a strong +IOD event coincided with a record-breaking ENSO year. That year, the predictions were for a ‘below normal’ monsoon, but, thanks to a positive IOD, it turned out to be a normal monsoon year. The year 2019 convincingly supports this claim, where the prediction of a normal monsoon was outshined by above-normal rainfall.
We must remember that IOD being a local factor plays an extremely crucial role in determining the fate of our monsoon.
The rise of IOD and fall of ENSO:
The effect of ENSO and its seasonal cycle on the Indian monsoon is relatively well understood. On the other hand, IOD being a local phenomenon has a lot of variabilities associated with it and its seasonal cycle is also not very well understood.
But, it is reasonably well documented that +IOD bores well for the Indian monsoon (owing to the over-activation of Arabian Sea branch), especially bringing good rains to the West Coast, Northwest and the Central Indian region. Interestingly, unlike ENSO, wherein a six-month moving average is required to tag it an “ENSO year”, in case of IOD, as soon as the DMI index starts climbing, the monsoon gains strength.
This probably points to the fact that the ocean-atmosphere response and coupling is much quicker in the case of IOD than the ENSO, since former a localized phenomenon in the Indian Ocean.
During the 2019 monsoon season, monthly IOD and ENSO indices clearly show that ENSO was masking the IOD effect up until June 2019 (see figure: Rise of IOD and the fall of ENSO). The weak ENSO effect could be attributed to the delayed onset of monsoon as well as below normal performance in June 2019.
Figure: Rise of IOD and the fall of ENSO (Shows the clear signature of +IOD from July-September 2019).
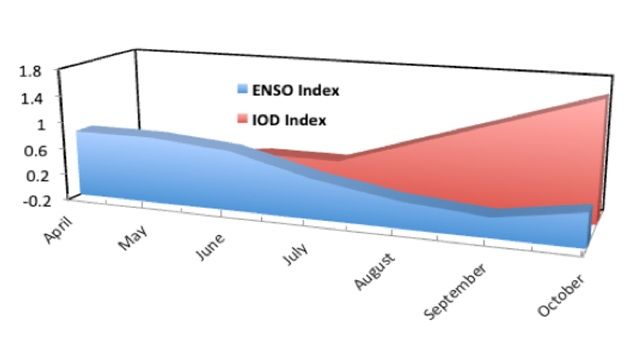
Starting July 2019, the IOD index accelerated and surpassed ENSO index by a huge margin. The rise of IOD and fall of ENSO was clearly observed in the rainfall patterns of 2019 monsoon season, wherein June 2019 recorded a massive minus 33 per cent countrywide rainfall deficit, while the next three months — July, August, and September — all ended in excess rainfall, leading to an overall 10 per cent excess monsoon rainfall (110 per cent of the LPA).
The positive IOD started peaking from July 2019 and kept soaring (like a stock market bull) until September 2019, thereby recording strongest positive IOD season ever recorded in the history of the Indian summer monsoon.
While almost all global climate models did indicate an occurrence of +IOD from July 2019, none of them predicted such a strong IOD to emerge this year. All the models predicted a nominal DMI value, which resulted in a normal monsoon forecast. Strong DMI values are indicative of huge moisture surge from the Arabian Sea leading to excess rainfall, which is what happened during July-September 2019.
Intricacies of forecasting monsoon
It is widely accepted that monsoon prediction is a formidable task owing to the seamless interplay of multivariate spatio-temporal scales in the ocean and atmosphere. For instance, on a spatial scale, one has to account for the movement of synoptic-scale waves — such as Kelvin and Rossby waves — their dynamics and their ability to evolve/devolve ENSO and IOD event.
On the temporal scale, the coupling of ocean and atmosphere is an important dynamical metric. Unless the atmosphere responds to the ocean variability, the monsoon currents would not energise. We saw the effect of variable temporal scale on ENSO and IOD, and its impact on our monsoon this year.
But, the complexity of monsoon forecasting does not end here. The Madden-Julian Oscillation (MJO), Inter-tropical Convergence Zone (ITCZ), Pacific Decadal Oscillation (PDO), Atlantic Ocean Dipole Zonal Mode (AODZM), and the Arabian Sea and Bay of Bengal branches of the monsoon, all of these have a spatio-temporal signature of their own.
There is no other chaotic and highly non-linear dynamical system than the Indian monsoon; the precise reason it has captivated the global weather agencies and scientists. And, the changing climate is not making things easier as far as forecasting the monsoon is concerned.
At the end, we must remember that every monsoon season is different. However, the southwest monsoon 2019 would be remembered for its twists and turns, and the numerous rainfall records it broke, despite a late onset and 33 per cent deficient rainfall till June end.
In cricketing terms, 2019 southwest monsoon season found a perfect all-rounder (positive IOD) and a slogger (devolving ENSO) combination near the tail end of the season.
Meanwhile, for the long-range forecasting community, one of the important learnings is to not jump the gun, since local circulation patterns could take control of the monsoon dynamics. It is also important not put all your money in one kitty named ENSO. There is a need to embed the impact of other ocean-atmosphere coupled oscillations in the climate models.
Sridhar Balasubramanian is an associate professor of mechanical engineering and an adjunct faculty member at IDP Climate Studies at the Indian Institute of Technology Bombay (IITB).